> ## Documentation Index
> Fetch the complete documentation index at: https://guide.bajeti-ufahamu.org/llms.txt
> Use this file to discover all available pages before exploring further.
# Webapp: Analytics
> Running AI-powered analysis on collected feedback, and downloading reports.
## The Analytics tab
Every flow has an **Analytics** tab. It runs AI analysis over the feedback collected for the flow. It summarizes it, extracts sentiment, and surfaces recurring topics either for the whole document or for a single section.
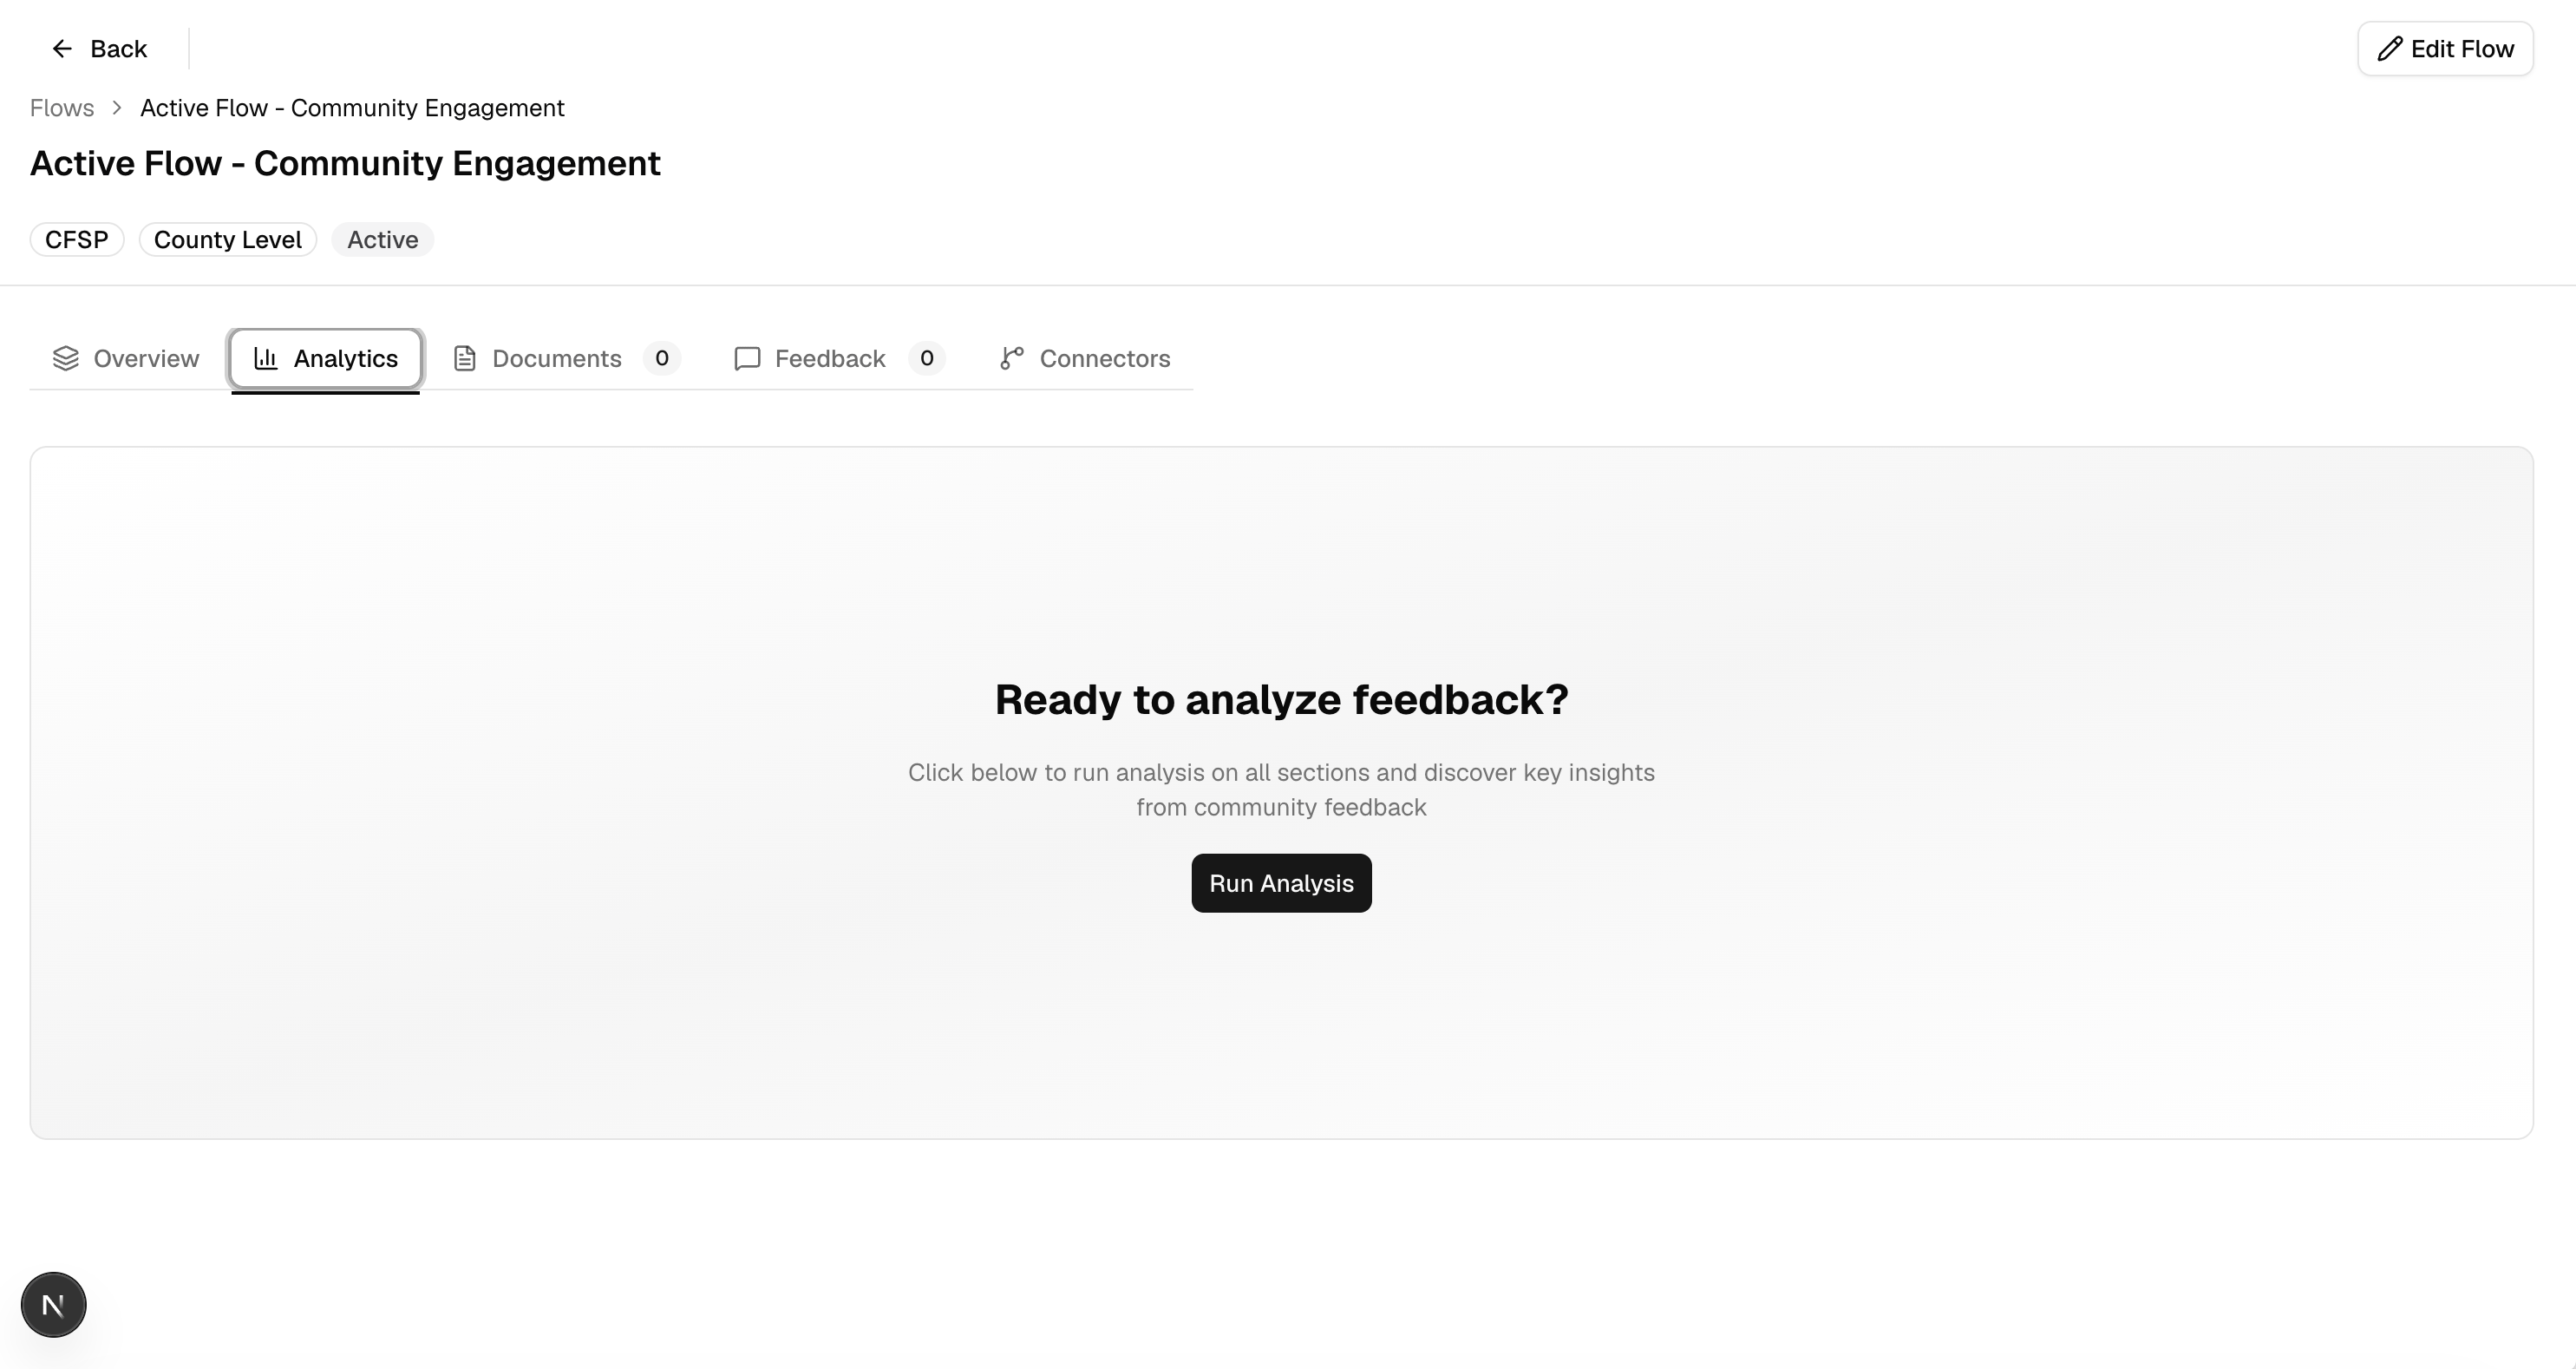 Analysis needs an infopack uploaded to the flow first : see [Upload a
document](/knowledge-base/webapp-documents#upload-a-document). Without one,
"Run Analysis" won't have anything to work from.
## Run analysis
Role access: all roles with access to the flow
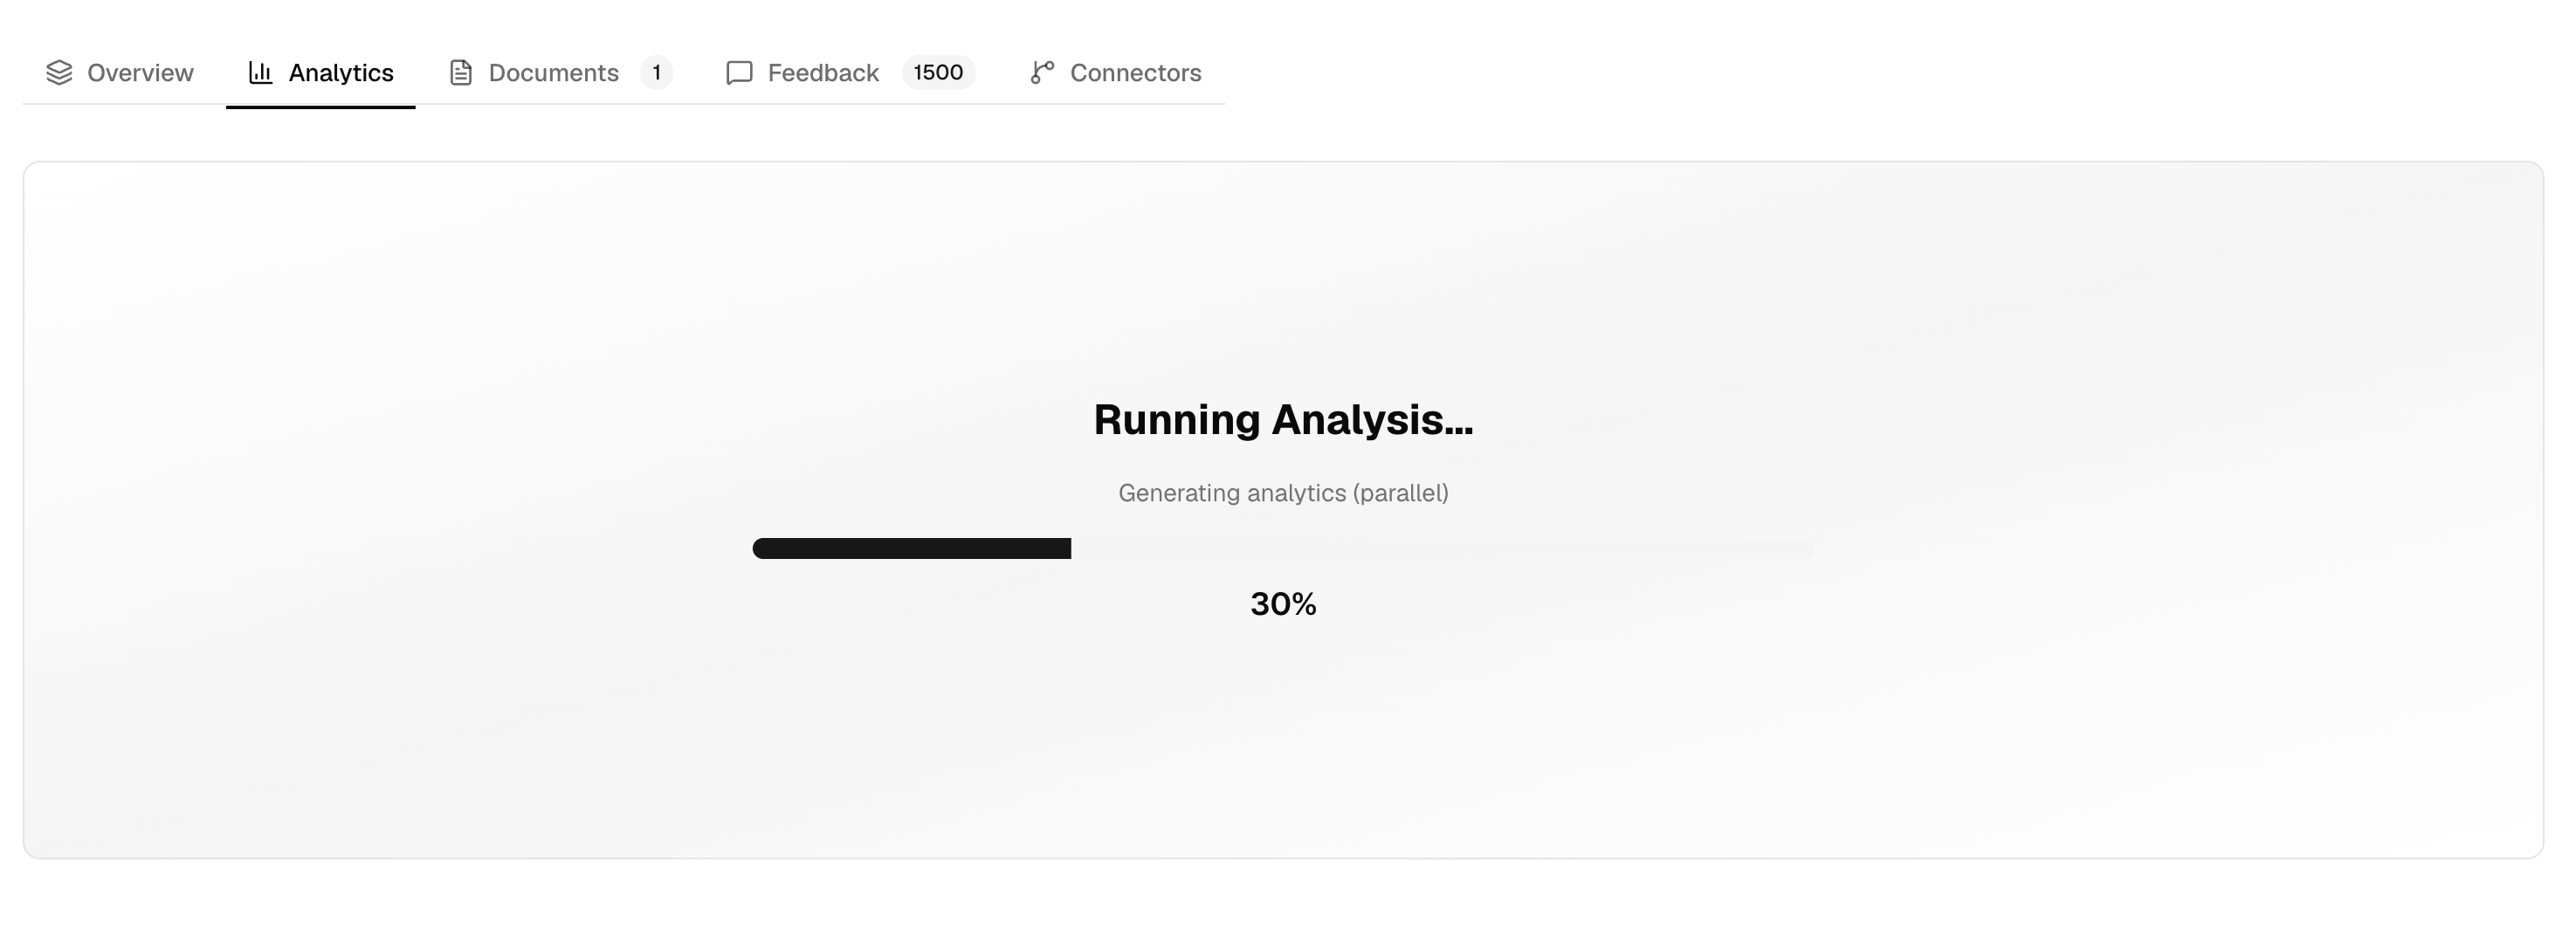
From the Analytics tab, click **Run Analysis**. A progress bar shows while the AI processes the feedback.
Analysis needs an infopack uploaded to the flow first : see [Upload a
document](/knowledge-base/webapp-documents#upload-a-document). Without one,
"Run Analysis" won't have anything to work from.
## Run analysis
Role access: all roles with access to the flow
From the Analytics tab, click **Run Analysis**. A progress bar shows while the AI processes the feedback.
 Once the whole-document analysis finishes, section tabs appear along the top (one per budget section, plus "Whole Document"). Select a section to view or analyze it individually.
 Click **Run Analysis** again for the selected section. Each section is analyzed independently, so results can be ready at different times.
## Read the results
Once analysis completes for a section (or the whole document), the tab shows:
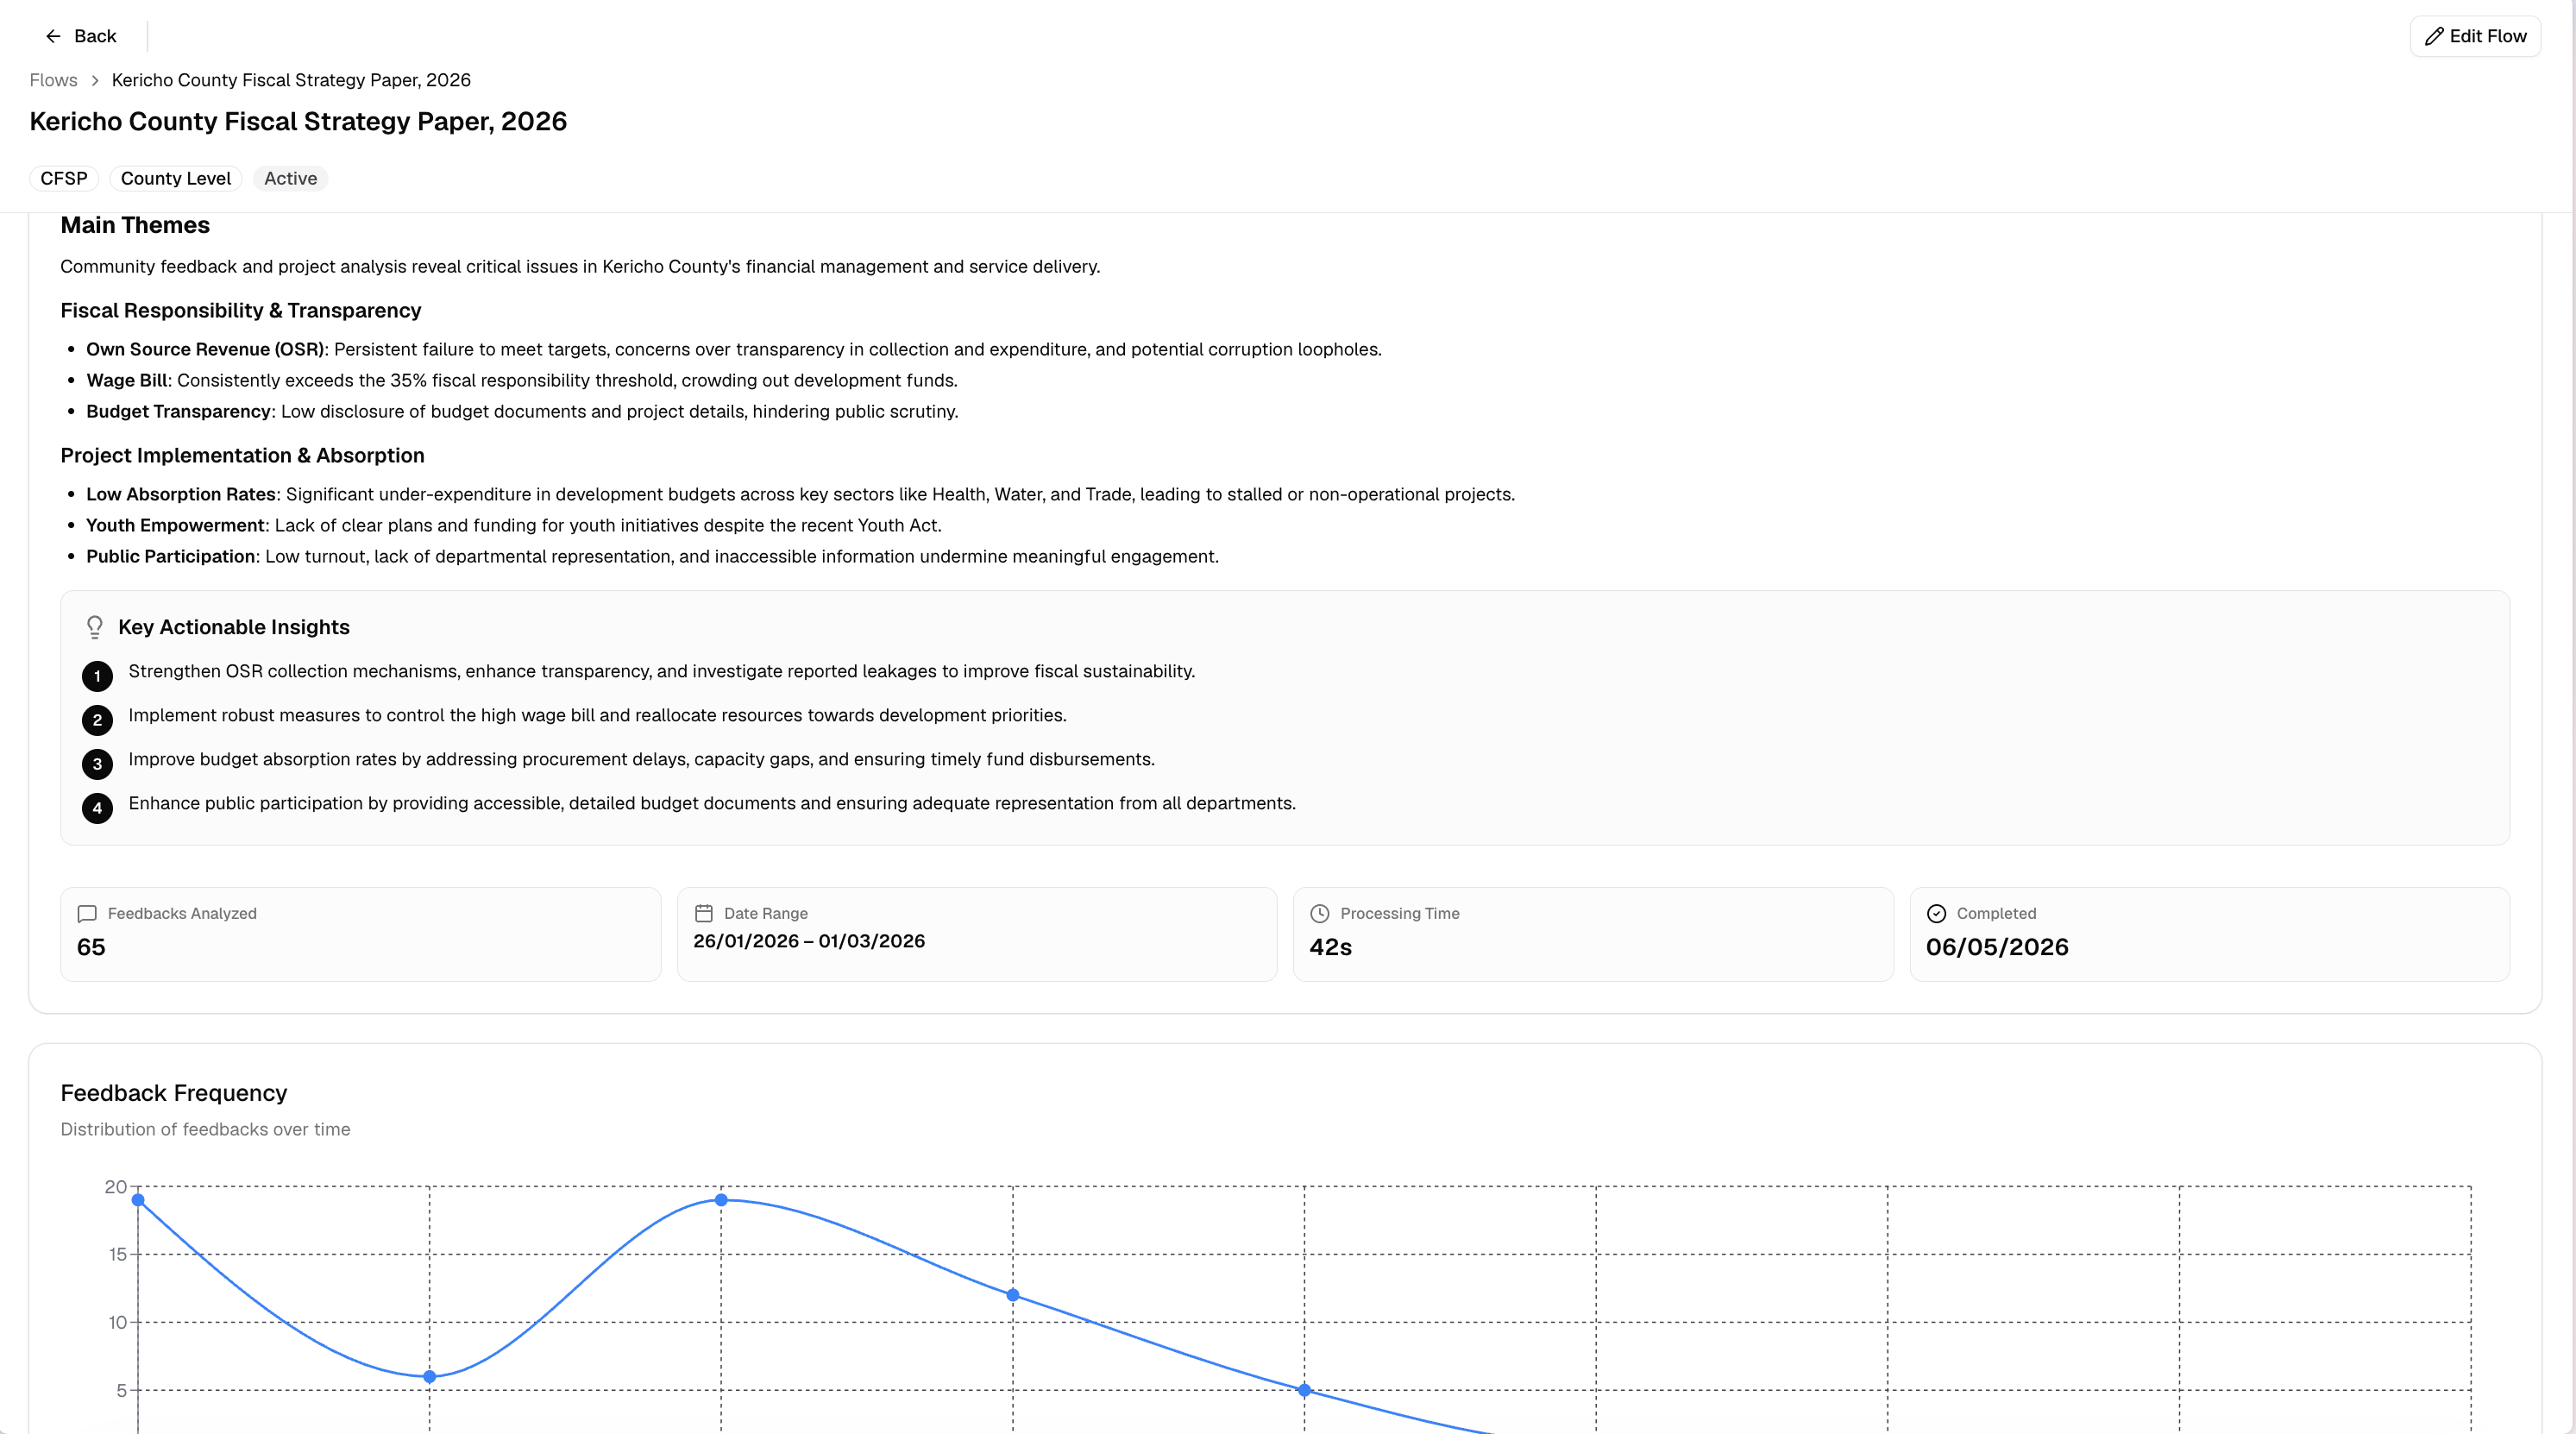
* **Feedback Summary**: a narrative summary, a list of key actionable insights, and stats: feedbacks analyzed, date range covered, processing time, and completion date.
* **Feedback Frequency**: a chart of how much feedback came in over time.
* **Word Cloud** and **Sentiment** : the most common terms in the feedback, and a breakdown of positive/neutral/negative sentiment, shown side by side.
* **Key Topics** : recurring themes, each with a mention count, overall sentiment, positive and negative points (click one to see the supporting quotes it's based on), and suggested next steps where available.
Click **Run Analysis** again for the selected section. Each section is analyzed independently, so results can be ready at different times.
## Read the results
Once analysis completes for a section (or the whole document), the tab shows:
* **Feedback Summary**: a narrative summary, a list of key actionable insights, and stats: feedbacks analyzed, date range covered, processing time, and completion date.
* **Feedback Frequency**: a chart of how much feedback came in over time.
* **Word Cloud** and **Sentiment** : the most common terms in the feedback, and a breakdown of positive/neutral/negative sentiment, shown side by side.
* **Key Topics** : recurring themes, each with a mention count, overall sentiment, positive and negative points (click one to see the supporting quotes it's based on), and suggested next steps where available.
 ## Download a PDF report
Role access: all roles with access to the flow
Download buttons only appear once that section has a result.
Click **Summary Report** for a shorter version (top 2 insights per topic), or **Full Report** for every insight.
## Download a PDF report
Role access: all roles with access to the flow
Download buttons only appear once that section has a result.
Click **Summary Report** for a shorter version (top 2 insights per topic), or **Full Report** for every insight.
 The PDF covers whichever section is currently selected : switch tabs first if
you want a different section's report.
The PDF covers whichever section is currently selected : switch tabs first if
you want a different section's report.